
Visualizing Software Quality with JIRA, Google Sheets, and Looker

March 19, 2025
Introduction
In the world of software development, quality is a critical factor. To measure and improve quality, metrics such as DDE (Defect Detection Efficiency), DRE (Defect Removal Efficiency), and DAA (Defect Age Average) are used.
In this article, we will see how to measure these metrics by extracting data from JIRA Cloud, analyzing them with Google Sheets, and finally visualizing them dynamically in Looker Studio to understand their evolution over time.
Step 1: Create a Google Sheet
Google Sheets allows us to organize, analyze, and transform data. The first step in setting up our system for storing metrics is to create a sheet with several tabs to store the list of detected issues by environment. In this case, we will have three tabs:
-
BUGs_Preprod: Issues in pre-production
-
BUGs_US: Issues during the development phase
-
BUGs_Prod: Issues in production
Once these tabs are created, we will add another one, DataStudio, where we will store the metrics calculated from the data in the other tabs, which will later be visualized in Looker Studio
Step 2: Collect Data from JIRA Cloud
We use JIRA Cloud as a project and issue tracking tool, and so it stores a large amount of valuable data related to defect lifecycle management. There are several ways to access this information, such as exporting data to CSV, using the JIRA API, or using the JIRA Cloud for Sheets extension. We will focus on this last option.
To use the JIRA Cloud for Sheets extension, we must ensure:
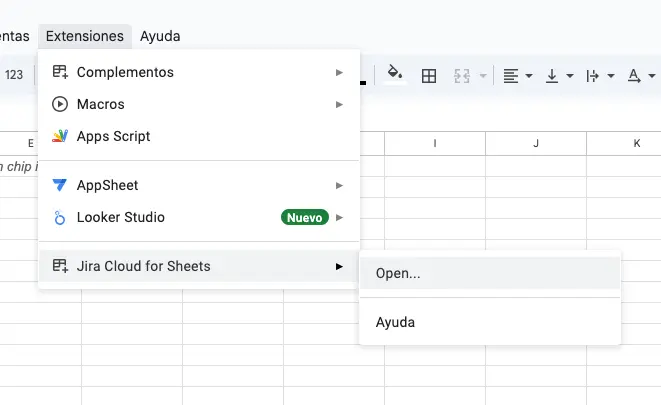
1- The extension is available in our Google Sheets environment. To do this, go to Extensions ⇒ JIRA Cloud for Sheets ⇒ Open…
2- The extension is connected to the JIRA Cloud instance we will be working with.

Once set up, we will extract relevant data using JQL (Jira Query Language), which is the most powerful and flexible way to search in JIRA.
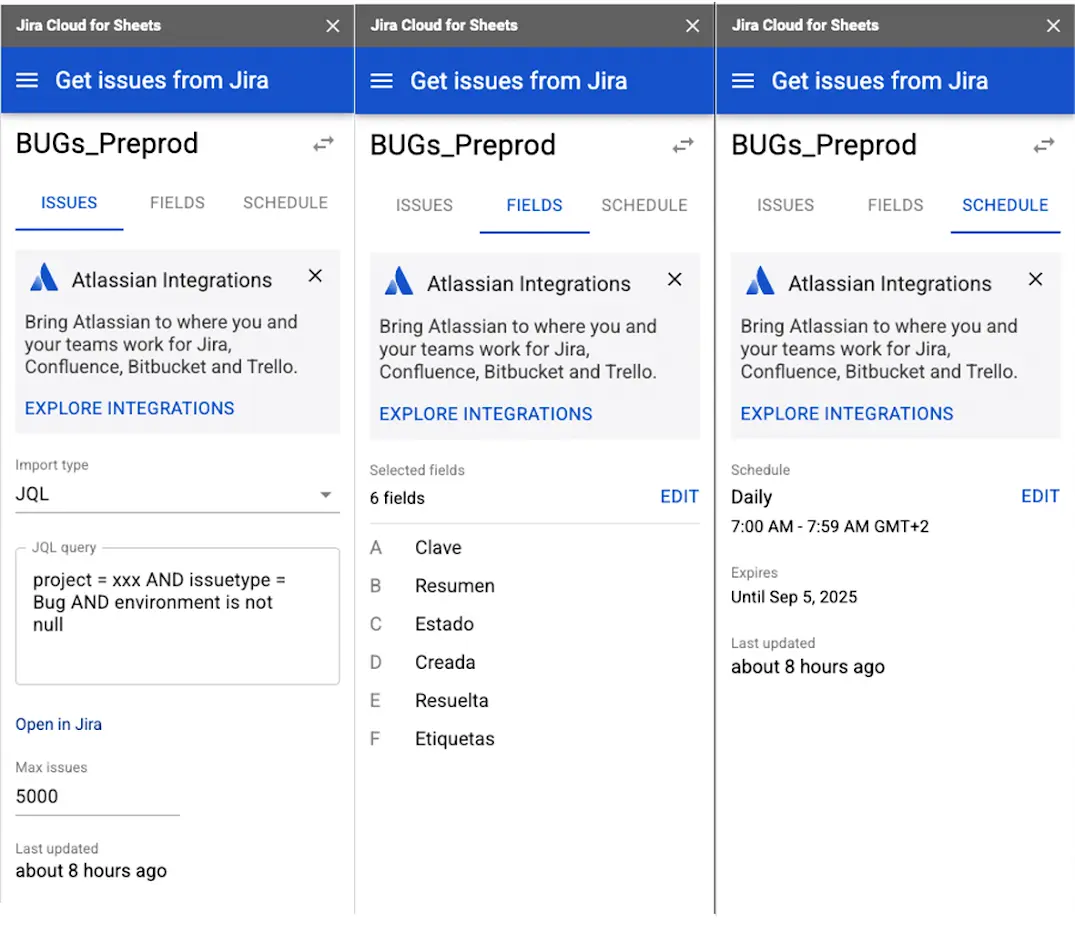
For this example, we will use one of the previously created tabs, BUGs_Preprod, and open the extension. The extension has three sections:
-
Issues: Where we specify the JQL query to retrieve the required data.
-
Fields: Where we define which columns/fields we want in our dataset.
-
Schedule: Where we set how often the data retrieval process should run.
After configuring these tabs, click on the Get issues now button that appears at the bottom of the extension. This will extract data from JIRA Cloud, and store it in the corresponding tabs. This operation must be repeated for each tab with the corresponding information depending on the JQL query.
Step 3: Calculate Metrics in Google Sheets
Now, we will work with the DataStudio tab we created earlier.
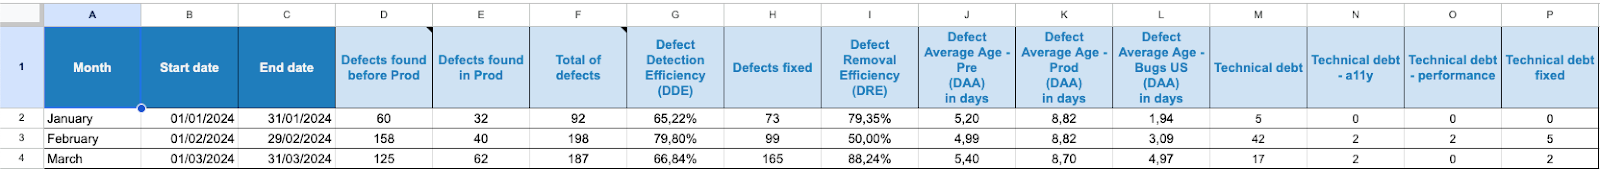
This tab will contain the following columns:
-
Month: A row for each month of the year.
-
Start Date: The first day of the month (format: dd/mm/yyyy).
-
End Date: The last day of the month (format: dd/mm/yyyy).
-
Defects Found Before Production: The count of defects found before production within the given date range.
-
Defects Found in Production: The count of defects found in production within the given date range.
-
Total Defects: The sum of all defects found within the given date range.
-
DDE (Defect Detection Efficiency): The number of defects found before production divided by the total defects identified within the date range.
-
Fixed Defects: The sum of defects created and resolved within the date range, where the JIRA status is Closed.
-
DRE (Defect Removal Efficiency): The number of defects created and resolved within the date range divided by the total defects identified.
-
DAA (Average Defect Age) - Pre: The average age of all pre-production defects.
-
DAA (Average Defect Age) - Prod: The average age of all production defects.
-
DAA (Average Defect Age) - US: The average age of all defects in the development phase.
Here is a template with the formulas we are going to describe below, and the app script for the calculation of one of them.
Defects Found Before Production
\=COUNTIFS(BUGs\_Preprod!$D$2:$D;">="&B5;BUGs\_Preprod!$D$2:$D;"<"&B6)+COUNTIFS(BUGs\_US!$D$2:$D;">="&B5;BUGs\_US!$D$2:$D;"<"&B6)
where:
-
BUGs_Preprod!$D$2:$D ⇒ is the column for the date of creation of the defect of the BUGs_Preprod tab
-
BUGs_US!$D$2:$D ⇒ is the column for the date of creation of the defect of the BUGs_US tab
-
&B5 ⇒ is the start date
-
&B6 ⇒ is the end date
Defects Found in Production
\=COUNTIFS(BUGs\_Prod!$D$2:$D;">="&B5;BUGs\_Prod!$D$2:$D;"<"&B6)
where:
-
BUGs_Prod!$D$2:$D ⇒ is the column for the date of creation of the defect of the BUGs_Prod tab
-
&B5 ⇒ is the start date
-
&B6 ⇒ is the end date
Total Defects
\=IF(AND(D5\="";E5\="");"";D5+E5)
where:
-
D5 ⇒ are the defects found before production
-
E5 ⇒ are the defects found in production
DDE
\=IF(F5\="";"";IF(F5\=0;1;IF(D5/F5\>1;1;D5/F5)))
where:
-
D5 ⇒ are the total defects found
-
E5 ⇒ are the defects found before production
Fixed Defects
\=COUNTIFS(BUGs\_Preprod!$D$2:$D;">="&B5;BUGs\_Preprod!$D$2:$D;"<"&B6;BUGs\_Preprod!$E$2:$E;">="&B5;BUGs\_Preprod!$E$2:$E;"<"&B6;BUGs\_Preprod!$C$2:$C;"Closed")+COUNTIFS(BUGs\_US!$D$2:$D;">="&B5;BUGs\_US!$D$2:$D;"<"&B6;BUGs\_US!$E$2:$E;">="&B5;BUGs\_US!$E$2:$E;"<"&B6;BUGs\_US!$C$2:$C;"Closed")+COUNTIFS(BUGs\_Prod!$D$2:$D;">="&B5;BUGs\_Prod!$D$2:$D;"<"&B6;BUGs\_Prod!$E$2:$E;">="&B5;BUGs\_Prod!$E$2:$E;"<"&B6;BUGs\_Prod!$C$2:$C;"Closed")
where:
-
BUGs_Preprod!$D$2:$D ⇒ is the column for the date of creation of the defect of the BUGs_Preprod tab
-
BUGs_Preprod!$E$2:$E ⇒ is the column for the defect resolution date of the BUGs_Preprod tab
-
BUGs_Preprod!$C$2:$C ⇒ is the column for the status of the defect of the BUGs_Preprod tab
-
BUGs_US!$D$2:$D ⇒ is the column for the date of creation of the defect of the BUGs_US tab
-
BUGs_US!$E$2:$E ⇒ is the column for the date of resolution of the defect in the BUGs_US tab
-
BUGs_US!$C$2:$C ⇒ is the column for the status of the defect of the BUGs_US tab
-
BUGs_Prod!$D$2:$D ⇒ is the column for the date of creation of the defect of the BUGs_Prod tab
-
BUGs_Prod!$E$2:$E ⇒ is the column for the date of resolution of the defect in the BUGs_Prod tab
-
BUGs_Prod!$C$2:$C ⇒ is the column for the status of the defect of the BUGs_Prod tab
-
&B5 ⇒ is the start date
-
&B6 ⇒ is the end date
DRE
\=IF(F5\="";"";IF(F5\=0;1;IF(H5/F5\>1;1;H5/F5)))
where:
-
F5 ⇒ is the total defects found
-
H5 ⇒ is the number of defects fixed
DAA Calculation Using Google App Script
We define a script in Apps Script to calculate the defect age for each one of the tabs (BUGs_Preprod, BUGs_Prod, BUGs_US). The steps to follow would be:
1-Go to Extensions ⇒ App Scripts. This will open a new browser window.
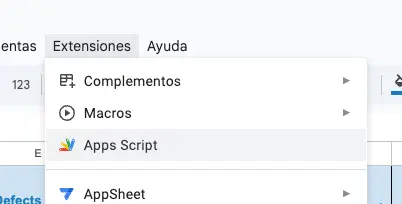
2- In it, click on the button + ⇒ Apps Script
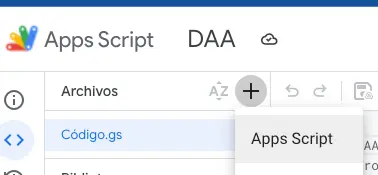
3- A new file will be created and we have to give it a name, e.g. Código.gs
4- In this file we paste the following function 3 times, changing the name of the function (getDAA_Prod and getDAA_US) and the tab we want to work with (BUGs_Prod and BUGs_US)
function getDAA\_Preprod(end\_date) {
  var sheet = SpreadsheetApp.getActive().getSheetByName('BUGs\_Preprod');
  var lastRow = sheet.getLastRow();
  var rangeCreatedDate = sheet.getRange(2, 4, lastRow).getValues();
  var rangeResolutionDate = sheet.getRange(2, 5, lastRow).getValues();

  var ageOfAllDefects = 0;
  var totalNumberOfDefects = 0;
  for (var row in rangeCreatedDate) {
var resolutionTime = new Date(rangeResolutionDate\[row\]);
if (resolutionTime < end\_date) {
  var createdTime = new Date(rangeCreatedDate\[row\]);

  //Age of a defect = Resolution Date - Creation Date
  var diff = resolutionTime.getTime() - createdTime.getTime();
  var ageOfDefectInDays = Math.round(diff / (1000 \* 60 \* 60 \* 24));
  Logger.log('createdTime: %s, resolutionTime: %s, ageOfDefectInDays: %s', createdTime, resolutionTime, ageOfDefectInDays);
  ageOfAllDefects += ageOfDefectInDays;
  Logger.log('ageOfAllDefects: %s days', ageOfAllDefects);
  totalNumberOfDefects++;
  Logger.log('totalNumberOfDefects: %s', totalNumberOfDefects);
}
  }

  if (totalNumberOfDefects == 0){
return 0;
  }

  var result = ageOfAllDefects / totalNumberOfDefects;
  return result;
}
Back in the google sheet, we call the defined functions in the columns where we want to have the calculation of the DAA. We repeat this for every tab on different columns, using the appropriate function names.
\=getDAA\_Preprod(B6)
where:
- B6 ⇒ is the end date
Step 4: Visualize Data in Looker Studio
Looker Studio (formerly Google Data Studio) is a data visualization platform that enables the creation of interactive dashboards.
To visualize the quality metrics calculated above, follow these steps:
Connect Looker Studio to Google Sheets:
Open Looker Studio and select Blank Report.
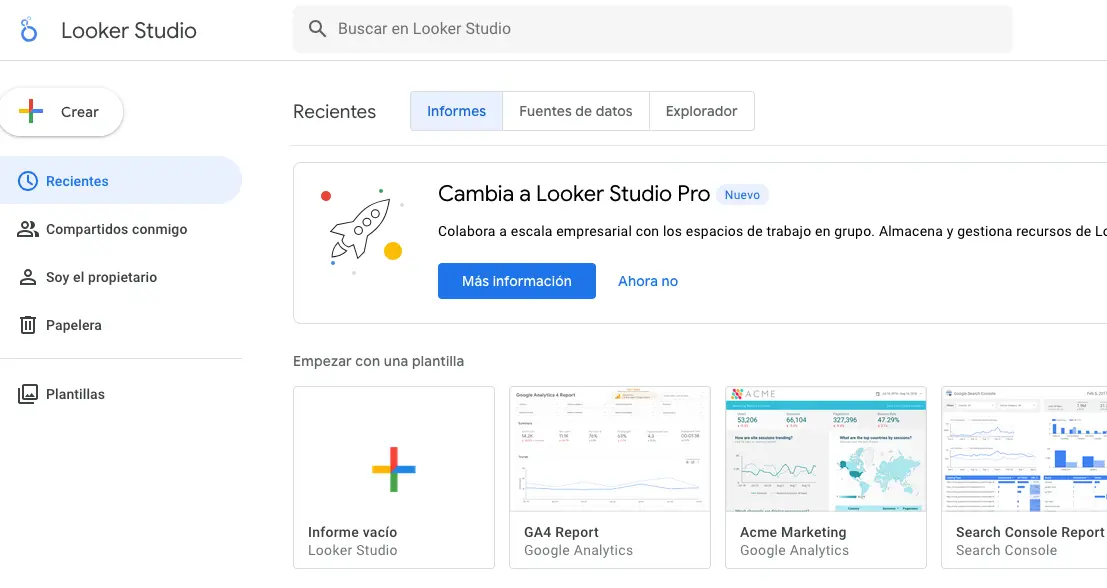
This action will open a screen like the following one where you can choose the data source to import your data from.
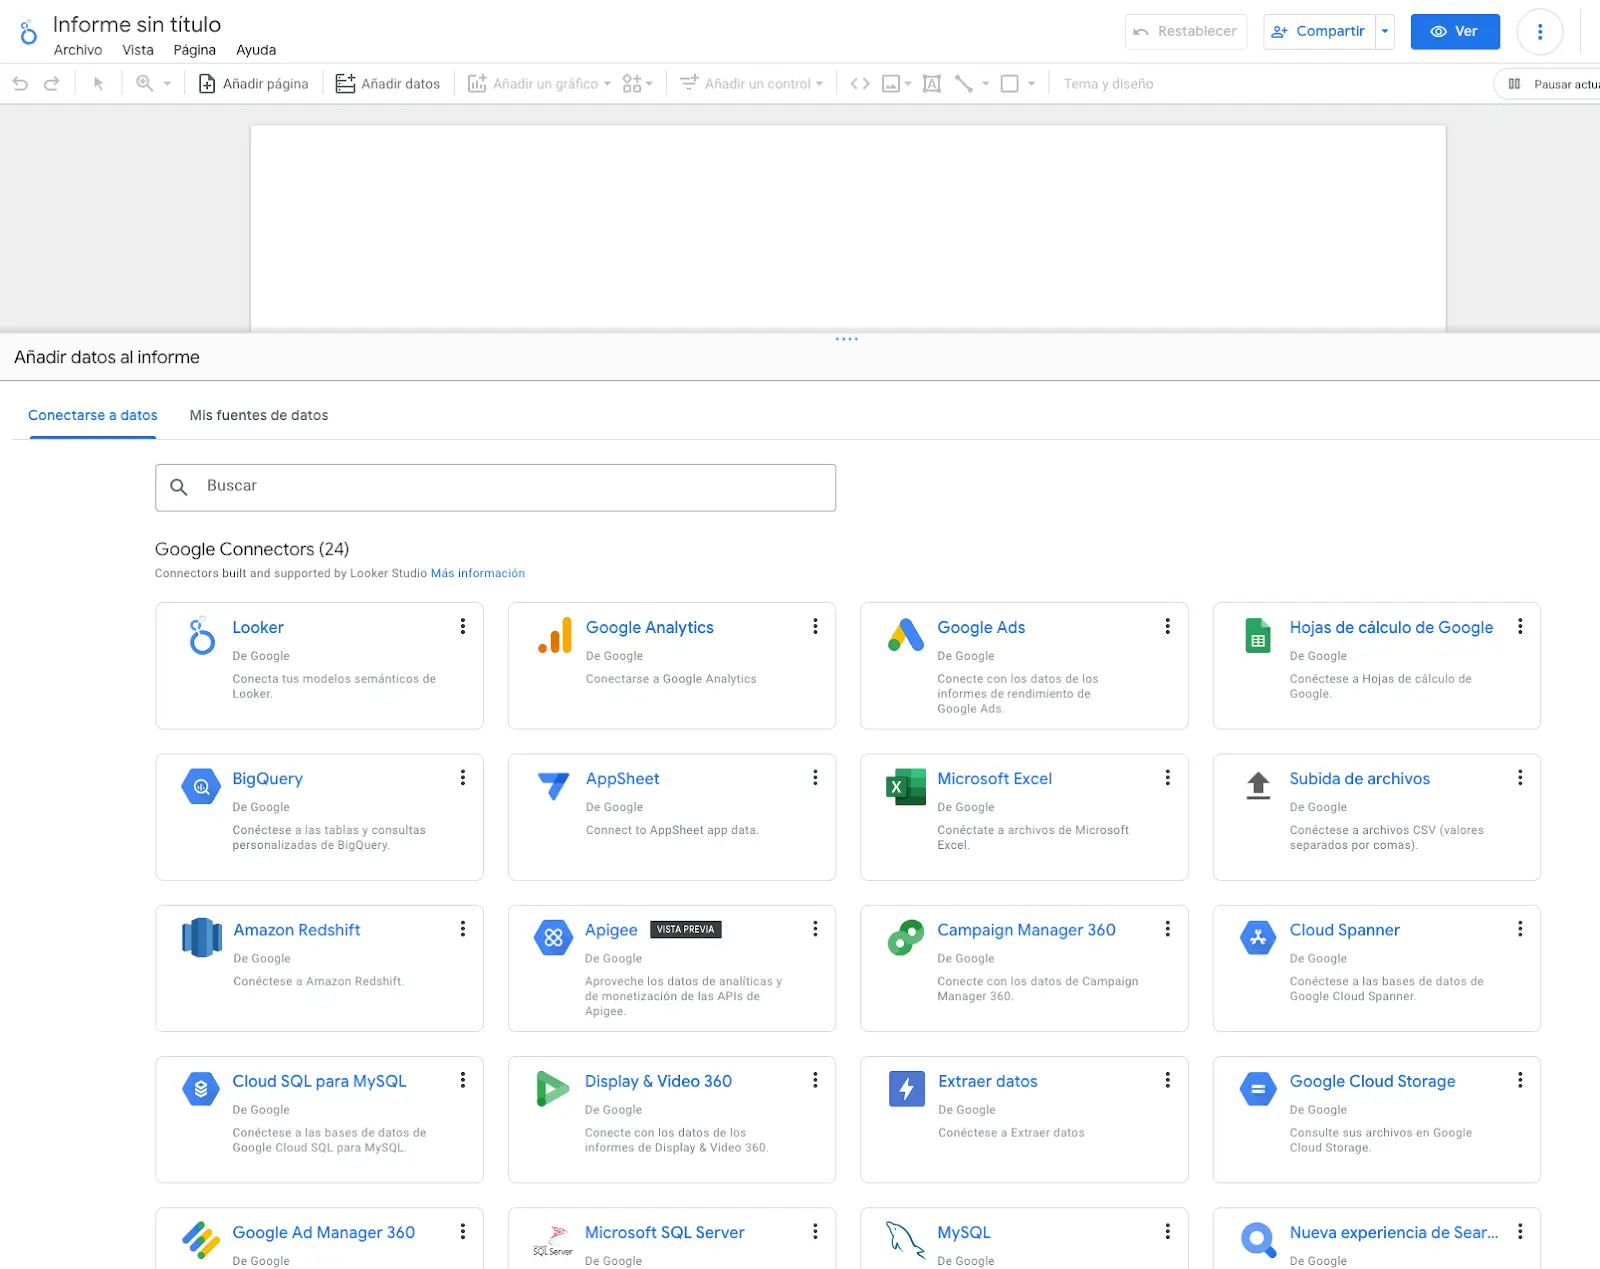
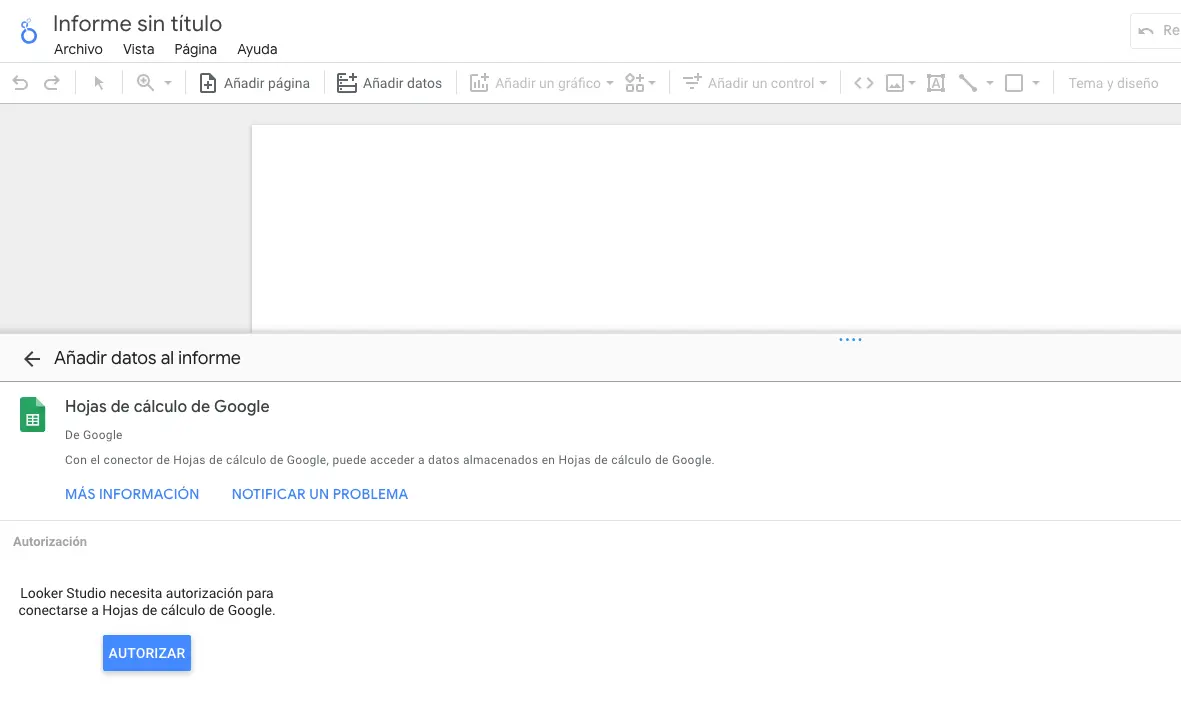
We are interested in the Google Sheets option, click on it and it will show the following window. Here we will be asked to give Looker Studio permissions to connect to Google Sheets.
Once the authorization has been completed, it will show a list of Google Sheets it has access to. We can then select the one we are interesting in, as well as the tab with the data we want to import. In our case, this is the DataStudio tab, so we select it and click on the Add button in the bottom right corner of the page.
With this, we will have our data from the DataStudio tab added in Looker Studio to create graphs with.
Create charts
Depending on the metric we are going to visualise, we will use one type of graph or another. In our case we will use:
-
Combo Chart for DDE and DRE
-
Line Chart for DAA.
To create a chart, click on Add a chart and select the one you want.
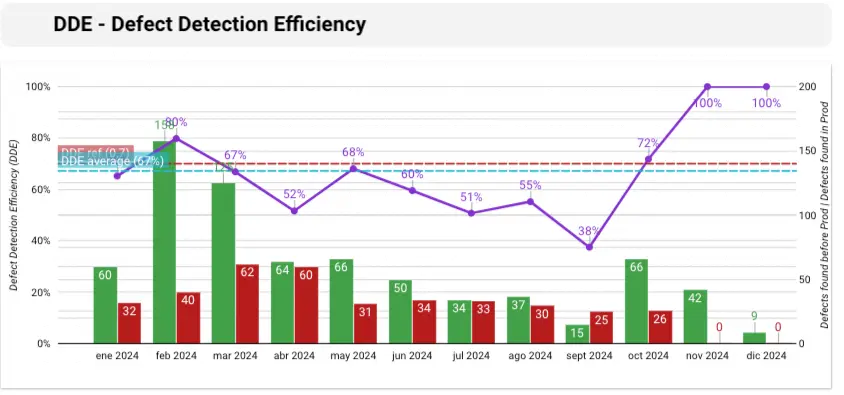
DDE
For the DDE chart we will have to make the following configuration after having selected the chart.
We will configure the following styles to visualise the data in the different series:
Once all of the above has been configured, the chart that will be displayed will look like the following:
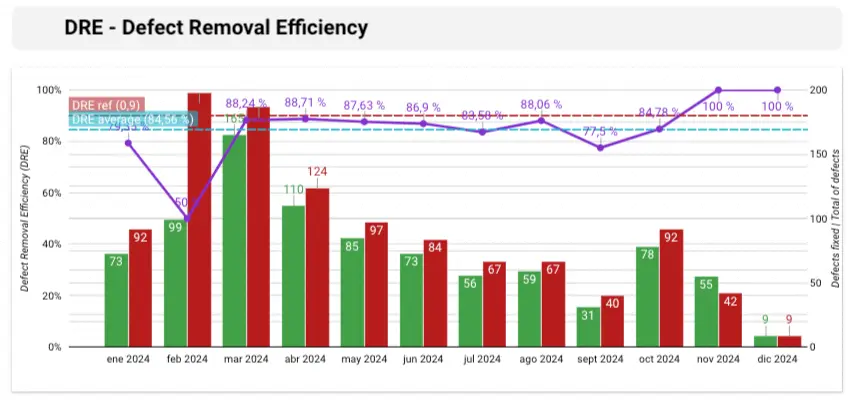
DRE
For the DRE chart we will have to make the same configuration and establish the same styles as for the DDE metric, changing only the 3 input metrics, which in this case would be:
-
DRE
-
Defects solved
-
Total defects
Once everything has been configured, the chart we will see will look like the following:
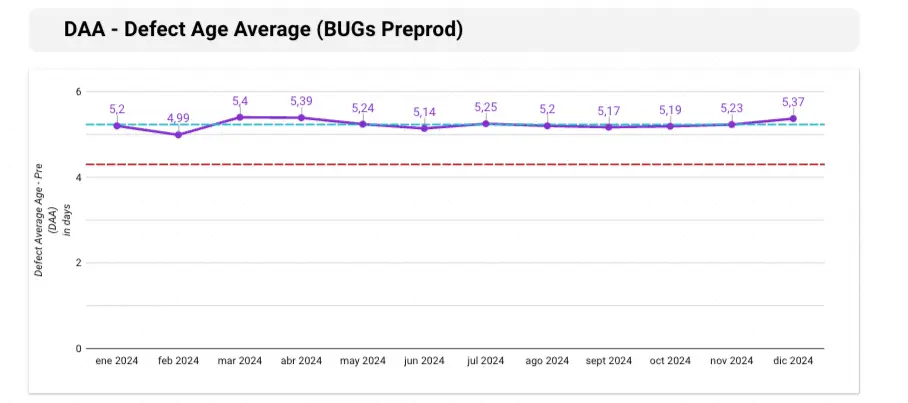
DAA
For the DAA chart we will have to make the following configuration after having selected the chart.
We will configure the following styles to display the data.
Once everything has been configured, the chart will look like the following:
Step 5: Analyze Quality Metrics Evolution
By visualizing DDE, DRE, and DAA in Looker Studio, we can identify trends and patterns over time. This allows us to:
-
Evaluate the effectiveness of quality improvement strategies: As you are implementing changes to your development processes, you can track their impact on quality metrics.
-
Identify problem areas: If certain metrics show a negative trend, you can investigate the underlying causes and take corrective action.
-
Compare the performance of different teams or projects: You can use quality metrics to compare the performance of different teams or projects and identify best practices.
What does DDE value imply?
-
A high DDE indicates that a significant percentage of defects present in the software has been identified during testing, suggesting a more effective defect detection process.
-
A low DDE may indicate that a large number of defects have gone undetected during testing, highlighting potential weaknesses in the testing approach.
What does DRE value imply?
-
A high DRE indicates a high efficiency in defect detection and correction, meaning that most defects have been identified and resolved during the specific phase.
-
A low DRE may indicate inefficiency in the defect detection process or the need for improvements in testing and defect correction methods.
What does DAA value imply?
-
A high DAA may indicate that defects have not been fixed within a reasonable time frame. This highlights the need of further investigation to surface issues with the process.
-
A low DAA indicates that the development team's ability to correct defects is quite fast.
Conclusion
This article presents a method to quickly calculate key software quality metrics using JIRA Cloud, Google Sheets, and Looker Studio. This approach helps centralize and automate quality tracking, making it accessible for all team members.
Our latest news
Interested in learning more about how we are constantly adapting to the new digital frontier?

Tech Insight
May 6, 2026
The Definitive Guide to Deploying Qwen3 on the NPU of the Orange Pi 5 Pro/Max/Plus/Ultra Using RKLLama and MicroK8s

Corporate news
April 21, 2026
We have integrated AMS Solutions to strengthen our capabilities in managed services and AI-assisted software development

Insight
March 25, 2026
The smartest AI is the one that knows your business best

Insight
February 5, 2026
Infinite Worlds: When the best graphic is your imagination